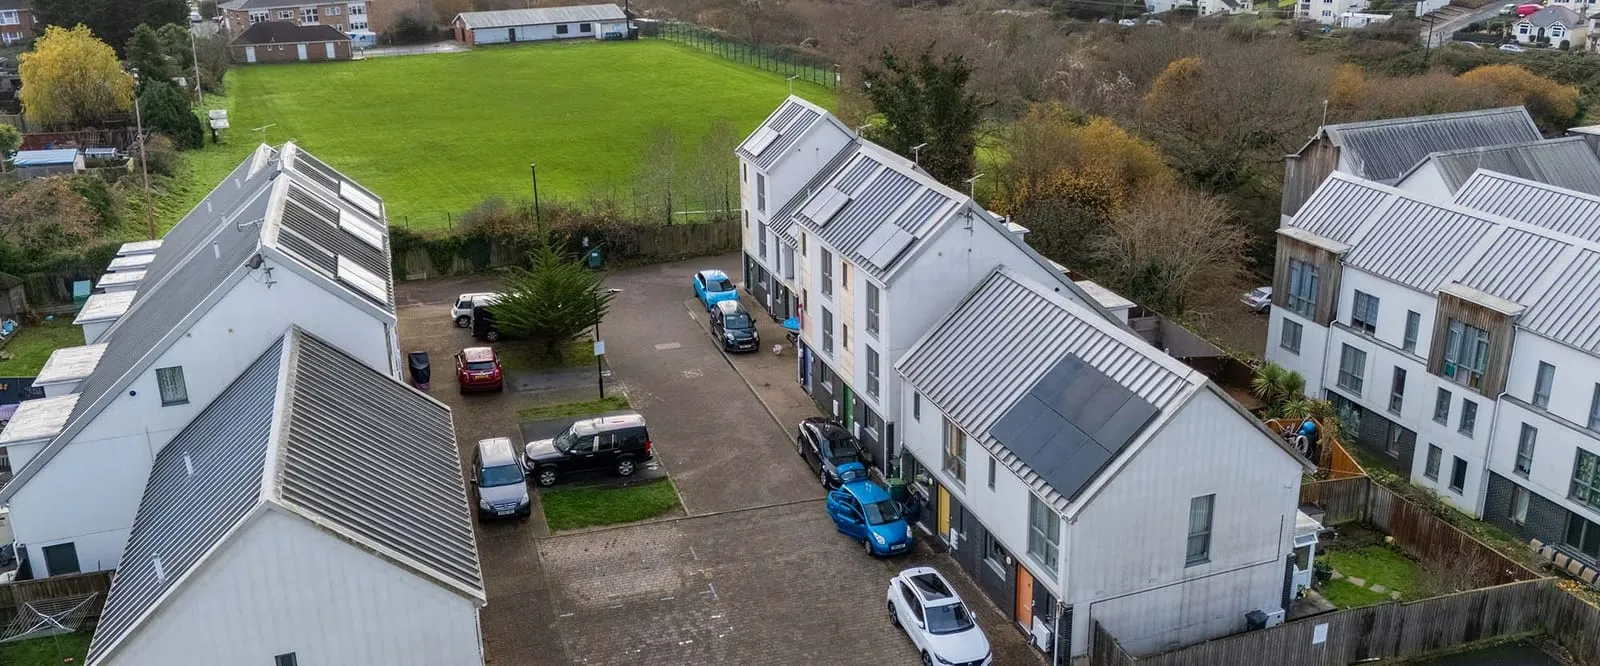
Southampton doesn’t get talked about as a solar market the way Bristol or Manchester do, but the fundamentals are better than the profile suggests. It’s a working port city of 269,781 people, sat in a South East irradiance band that pushes commercial systems to roughly 1,000 kWh per installed kWp a year — meaningfully ahead of the UK’s ~850 kWh/kWp national average — with a council that has bound itself to a hard 2030 net-zero deadline and a Freeport designation sitting directly on top of its logistics corridor. For installers and investors scoping the South Coast, that combination of policy pressure, above-average yield and port-driven roof stock is the actual story. Here’s the trade read.
The policy driver: a council with a 2030 deadline it can’t quietly slip
Southampton City Council adopted its Green City Charter in 2019, committing the authority’s own non-domestic estate to net-zero carbon by 2030 — a target the subsequent Green City Plan has translated into a published delivery programme rather than an aspiration on a webpage. That matters commercially in two ways. First, it creates direct procurement demand: council-owned buildings, schools and leisure estate need PV and are working against a fixed clock, not a rolling ambition. Second, and more valuable to the trade, a public net-zero commitment with 70-plus charter signatories — including the University and the Port — creates supply-chain pull-through. Anchor tenants and major employers who’ve signed the Charter face reputational and, increasingly, contractual pressure to decarbonise their own operations, which is how a council climate policy turns into commercial roof-mount enquiries three steps removed from the town hall.
This is worth flagging for installers used to treating local authority climate strategies as background noise. In Southampton it isn’t background — it’s a delivery plan with a date on it, and dates concentrate procurement into specific years rather than letting it drift.
Solent Freeport: the capital allowance most installers are underselling
The bigger commercial lever, and the one least understood on the tools side of the industry, is the Solent Freeport tax site designation covering parts of the Southampton port and logistics corridor. Under the UK’s standard “full expensing” capital allowances regime introduced in 2023, solar panels are explicitly carved out as a special-rate asset — they don’t qualify for 100% first-year relief outside a Freeport, only the 50% special rate allowance. Inside a designated Freeport tax site, that carve-out is overridden: qualifying plant and machinery, including rooftop and ground-mount solar, can claim a 100% first-year Enhanced Capital Allowance against expenditure incurred up to 30 September 2031.
That distinction — 50% relief in the general market versus 100% inside the Solent Freeport boundary — is a genuine commercial edge for any occupier or developer sitting on or near the port estate, and it’s the specific mechanism the council’s own economic development messaging leans on when it talks about “unlocking” commercial solar investment. It’s also a technical enough point that most SME occupiers won’t know to ask for it, which is exactly where a specialist quote should be doing the education rather than assuming the client has already worked out the tax position. Firms structuring finance around this should be building the ECA into the payback model from quote stage, not treating it as a bonus discovered at year-end — a case for pairing installer proposals with a proper look at commercial solar finance structures rather than a bare capex number.
Where the roof pipeline actually sits
Port-related logistics is the demand engine behind Southampton’s commercial roof stock, and three estates carry most of the near-term pipeline for anyone mapping the district.
| Estate | Character | Solar relevance |
|---|---|---|
| Eastleigh Lakeside | Modern business park stock, mixed office/light-industrial | Newer roofs, better load-bearing and orientation control for design-stage PV |
| Empress Road | Established industrial estate close to the docks | Older roof stock, higher retrofit complexity, strong daytime load profile |
| Solent Industrial Estate | Mixed light-industrial and distribution units | Classic warehouse-and-yard footprint suited to larger array coverage |
None of these are single-tenant mega-sheds on the scale of the Midlands “golden triangle,” but that’s the point commercially: mid-sized industrial and distribution units with daytime-heavy operating hours are close to the ideal load profile for self-consumption, because a warehouse or distribution shift pattern eats generated electricity as it’s produced rather than exporting most of it at low SEG rates. Installers targeting this corridor are better served pitching warehouse roof programmes and logistics-sector solar specialists framing than generic “commercial solar” messaging, because the buyer persona — an operations or facilities manager under energy-cost pressure, not a sustainability director — responds to load-matching and payback math, not carbon-first language.
The economics for a typical Southampton commercial occupier
The average Southampton commercial energy spend runs around £42,000 a year — a useful anchor for sizing conversations, because it implies a mid-size system rather than a token rooftop array. At the current commercial installed cost of roughly £900–£1,200 per kWp, a 50 kWp system lands somewhere between £45,000 and £60,000 before any allowance is applied. At the region’s ~1,000 kWh/kWp yield, that system generates around 50,000 kWh a year. On a warehouse or distribution shift pattern with reasonably strong daytime self-consumption — say 65–70% used on-site against a roughly 25p/kWh import rate — that’s in the region of £8,000–£9,000 a year in avoided grid purchase, with the remaining exported volume adding a few thousand pounds more at whatever SEG rate the supplier offers (top-end tariffs currently sit around 12–20p/kWh; it is genuinely supplier-specific and worth shopping rather than assuming). Simple payback lands in the 5–6 year range on the unallowanced capex — materially shorter once the Freeport ECA is factored into first-year cash flow for sites that qualify.
It’s also worth noting Southampton’s local economic profile when pitching this: average house prices in the city sit around £240,000, below the wider South East average, which is a rough proxy for a city built on operational trades and logistics rather than high-margin professional services. That’s a market where a five-to-six-year payback with a documented capital allowance benefit is a persuasive commercial argument on its own — it doesn’t need decarbonisation framing to close, which should shape how proposals are written for this specific buyer base.
The installer landscape
The South Coast has genuine specialist depth rather than a vacuum waiting to be filled by out-of-area national installers. South Coast Solar Solutions covers the immediate coastal corridor, while Solent Solar works the wider Hampshire commercial base — both are relevant reference points for occupiers in Eastleigh, Southampton and the surrounding Solent towns comparing quotes. For a broader view of who’s active on commercial-scale work specifically in the city, the commercial solar panels Southampton hub and the dedicated solar for businesses in Southampton location page both track installer activity and typical commercial specs for the area, and are a sensible starting point before requesting quotes.
Whoever occupiers choose, MCS certification remains the non-negotiable gate: it’s required for Smart Export Guarantee eligibility, and given SEG rates vary meaningfully by supplier rather than sitting on a fixed national tariff, an installer’s willingness to actually shop export rates on a client’s behalf — rather than defaulting to whichever supplier they have an existing relationship with — is a real point of differentiation worth asking about at quote stage.
Reading Southampton against the national picture
The national backdrop gives this local pipeline some context. 2025 was a record year for UK solar deployment — 257,397 MCS-certified installations, up 32% on the prior year, taking cumulative deployment to around 21.6 GW and roughly 6.4% of UK electricity generation, per MCS’s own certification data. Commercial and industrial deployment has been a growing share of that total as capital allowances, rising import prices and corporate procurement pressure have converged. Southampton fits that national pattern almost exactly, but with two local accelerants layered on top that most UK cities don’t have: a council-level 2030 deadline with a published delivery plan behind it, and a Freeport tax site that restores 100% first-year relief on an asset class the general capital allowances regime otherwise discounts. For installers weighing where to put South Coast sales effort, and for investors sizing the addressable commercial roof stock around the port, that’s a more specific and more time-bound case than “the South East gets good sun” — which remains true, but was never going to be the reason deals close.
For readers tracking the wider cost and policy picture behind numbers like these, thecostofsolar.co.uk’s commercial cost breakdown is a useful cross-reference on national installed pricing, and our own UK solar industry 2026 data sets Southampton’s Freeport-driven pipeline against the broader market trend.
The practical takeaway for the trade: Southampton’s commercial opportunity is real but narrower and more specific than “port city, lots of roofs.” It’s concentrated in mid-size logistics and light-industrial stock around Eastleigh Lakeside, Empress Road and the Solent Industrial Estate, it’s sized by a genuinely above-average ~£42,000 annual commercial energy spend, and it’s sharpened by a Freeport capital allowance that most quotes in the area still aren’t leading with. Installers who build the ECA into the first conversation, rather than the small print, have a real edge on this patch.