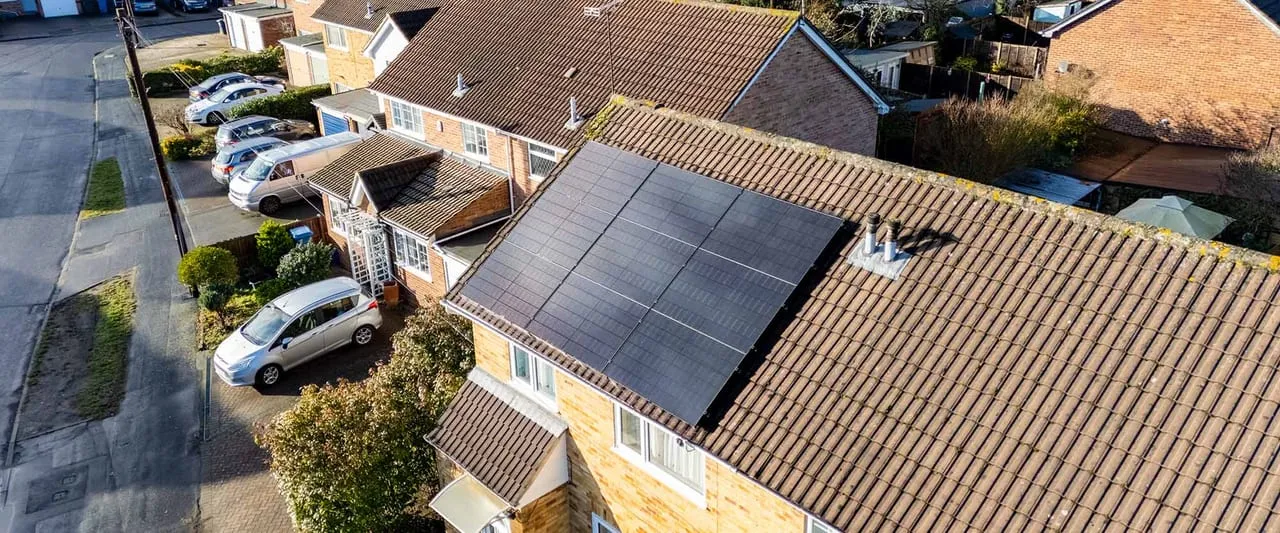
The maths of running a UK solar installation business changed twice in the last three years: first the post-2022 demand surge made almost any installer profitable, and now a crowded, price-transparent market is squeezing the same installers on both volume and margin at once. With 257,397 MCS-certified installs completed in 2025 (up 32% year-on-year) spread across a national installer base that has grown just as fast, the average firm isn’t necessarily doing more work — it may simply have more competitors chasing the same leads. This piece looks at the unit economics behind a typical residential-plus-commercial installer, where the 49-installs-a-year number actually comes from, and where the money is genuinely won or lost.
The 49-installs-a-year number, and why it matters
Take the 2025 MCS total of roughly 257,000 domestic and small-commercial installs and divide it across an estimated installer base in the low-to-mid five-thousands (MCS-certified firms doing PV, not all of whom are full-time or solar-only). Depending on which installer-count estimate you use, that lands somewhere in the 45-55 installs-per-firm-per-year range — call it “49” as a working median for a full-time, MCS-certified residential installer with one or two crews.
That number matters because it’s the denominator against which every fixed cost in the business has to be recovered: the certification, the insurance, the office admin, the sales team’s basic salary, the van lease, the showroom or unit. A firm doing 49 jobs a year at an average system size of 5-6 kW and a typical job value of £6,500-£9,000 is turning over somewhere between £320,000 and £440,000 — before materials, labour and customer acquisition cost are stripped out. That sounds healthy until you model what’s actually left once every line item is accounted for, which is where most of this article is going.
It also means installer businesses live and die on throughput, not on any single job’s margin. A firm running at 30 installs a year is not a smaller version of a 49-a-year firm — it’s a different business, because fixed costs don’t scale down proportionally. This is one reason the market has consolidated: sole traders and two-man bands who built a book during 2022-2023 at inflated margins are struggling now that customer acquisition costs have risen and price comparison has become the default customer behaviour, while multi-crew regional installers with proper systems can spread the same fixed cost over more jobs.
Where the pricing pressure is actually coming from
Three things are compressing margin simultaneously, and it’s worth being precise about which is which because the fixes are different for each.
Panel and inverter hardware costs have fallen faster than installed prices, which should be good news — a 4 kW system installed for £6,000-£8,000 in 2026 reflects genuinely cheaper N-type TOPCon and HJT modules than the same job would have cost in 2022. But hardware deflation has been matched, not exceeded, by installed-price deflation, because comparison-site and marketplace pricing pressure has passed nearly all of that saving straight to the customer. The margin pool that used to sit in the hardware line has largely gone.
Customer acquisition cost has risen because paid search and comparison-site referral fees have both gone up as more installers bid for the same finite pool of homeowner enquiries. A lead that cost £30-£50 in 2022 can cost £80-£150 now in competitive postcodes, and comparison sites typically take a referral fee on top of what the customer already paid to be acquired. Firms that rely entirely on paid lead generation are effectively paying twice for the same customer — once to the ad platform, once to the marketplace — and that’s before their own sales team’s time is costed in.
Organic and referral-driven demand is the only channel where acquisition cost doesn’t rise with competition. This is the uncomfortable structural point for installers who haven’t invested in it: a firm ranking organically for “[service] + [town]” queries, or with a genuine local reputation, is acquiring customers at close to zero marginal cost per job, while a firm buying every lead pays an acquisition cost that eats 10-20% of job value before a single panel goes on a roof. We’ve written previously about the SEO side of this specifically — see our piece on solar installer marketing — but the commercial logic is simple: if two installers have identical hardware costs and crew day-rates, the one with lower acquisition cost wins the pricing war every time, because they can match the competitor’s quote and still hold margin.
Zero-rated VAT is compressing the comparison further by making it easier for customers to accurately price-check quotes against each other — 0% VAT on residential solar and battery storage (in place in Great Britain until 31 March 2027) removes a variable that used to obscure like-for-like comparison, so customers are now comparing supply-and-fit prices net of tax distortion. That’s good for the industry’s credibility, but it means an installer can’t hide a thin quote behind VAT confusion the way they once could.
Where margin is actually won or lost
Given all of the above, the controllable levers sit in a fairly short list, and most underperforming installers are weak on more than one of them.
Attachment rate on batteries is the single biggest margin lever most installers under-exploit. A PV-only job at £7,000 and a PV-plus-battery job at £11,000-£16,000 (battery systems typically running £4,000-£8,000 installed, or £8,500-£10,500 for a 13.5 kWh unit like a Powerwall 3) don’t just differ in revenue — they differ in gross margin percentage, because the incremental sale carries almost none of the fixed acquisition cost the first sale already absorbed. An installer converting 25% of PV customers to battery attach is running a structurally better business than one converting 10%, even with identical crew costs.
Commercial and small-business work carries better day-rate economics than domestic, largely because commercial roofs are typically flatter, larger, and more standardised per kWp (commercial installed costs of roughly £900-£1,200/kWp compare favourably on a crew-day basis to fragmented domestic roof geometry), and because commercial customers buy on payback calculation rather than on emotional or environmental grounds, which shortens the sales cycle. Firms that have built even a modest commercial pipeline alongside domestic — sheds, warehouses, farm buildings, care homes, church halls — are diversifying against the domestic price war rather than competing directly inside it. Directories like Solar Panels For Warehouses and Solar Panels For Care Homes exist precisely because that buyer behaves differently from a homeowner, and installers who understand the difference in sales approach tend to close commercial work at a materially better margin than their domestic average.
Callback and O&M revenue is where a lot of installers leave money on the table entirely. A system installed in 2018-2020 is now inside the window where string inverters (typically 10-15 year life) start failing, and where degradation checks, panel cleaning and monitoring contracts are a legitimate recurring revenue line rather than an afterthought. Specialist operators such as Solar Maintenance Solutions treat this as the core business rather than a favour to existing customers, and the economics support that: a maintenance contract has near-zero acquisition cost (the customer already trusts you) and high margin, because it doesn’t compete on the same price-comparison sites as a new install.
Finance partnerships extend affordable ticket size without the installer carrying credit risk. Commercial customers in particular often want to spread a £30,000-£100,000 system cost against projected energy savings rather than paying cash, and installers who can point a commercial prospect toward structured options — whether that’s a broker relationship or resources like Solar Asset Finance or the PPA model explained at Solar Power Purchase Agreements — close deals that a cash-only sales process would lose to a competitor offering payment terms.
The regional installer’s actual playbook
Looking at how the healthier regional installers are actually operating in 2026, a pattern repeats: they haven’t tried to out-discount the marketplace-driven price war, they’ve tried to exit it. ElectriFusion Solutions in South Yorkshire and FLD Electrical in Swansea both combine solar with general electrical work, which means a portion of their solar leads come from an existing electrical customer relationship rather than a cold marketplace click — acquisition cost close to zero on that slice of the book. Ecoaim in Livingston and Greenlinc Renewables in Lincolnshire have built enough local reputation and organic visibility that a meaningful share of enquiries arrive pre-qualified and already trusting the brand, rather than as a three-quote comparison shop.
That’s the strategic answer to the margin squeeze described above: it isn’t really a pricing problem, it’s an acquisition-cost problem wearing a pricing disguise. Two installers with identical crew costs, identical hardware pricing and identical quote can have wildly different margins because one paid £120 to generate the enquiry and the other paid £15. Firms serious about fixing their margin should be auditing acquisition cost per channel before they touch their price list — a full cost-of-solar breakdown, including where installer margin typically sits inside a domestic quote, is covered in more depth at thecostofsolar.co.uk.
What this means for the next 12 months
The Great British Insulation-adjacent grant landscape isn’t going to bail out margin pressure — there’s no universal home-solar grant in England, ECO4 and Warm Homes support is means-tested toward low-EPC low-income households rather than the general market, and the Boiler Upgrade Scheme’s £7,500 doesn’t touch solar PV at all (it’s heat-pump-only). Farm and agricultural solar has its own grant route via the Improving Farm Productivity grant (around 25% of eligible cost in England, with different rates in the devolved nations) rather than any 40%-style figure sometimes still quoted — installers pitching agricultural clients need that number right or risk a credibility hit on the first sales call. The 0% VAT window closes (reverting to 5%, on current legislation) on 31 March 2027, which gives installers roughly nine months from this article’s publication to use it as a genuine deadline-driven sales prompt rather than background noise.
None of that changes the core arithmetic: an installer doing 49 jobs a year needs to know, line by line, what each acquisition channel actually costs, what each job actually nets after crew time and materials, and which of PV-only, PV-plus-battery, domestic or commercial is actually carrying the business. The installers thriving in 2026 aren’t the cheapest quote in the inbox — they’re the ones who worked out which 49 jobs to chase.